Understanding Bring a Trailer: Sell-through rate
February 6, 2022
This is part of a series of articles about the online auto auction platform, Bring a Trailer. For my other posts about Bring a Trailer, click here.
This is the first in a series of articles about Bring A Trailer, a popular online auction platform for automobiles and related items. I have been a regular observer of Bring a Trailer (BaT) for years, participating as a bidder and seller. Initially, I became interested in gathering and analyzing data about BaT because I was curious about patterns of bidding- when people bid, how often and how much. As I began gathering data and writing, I realized there were many more insights that could be derived from this data. Starting from my initial curiosity about bids, I ended up with an outline for a series of articles on Bring a Trailer, each describing some aspects of the auction platform, supported by data, some light statistical analysis and visualizations.
In this article, I’ll give a short introduction to the Bring a Trailer auction platform. I’ll also describe the data gathering methodology that underpins the analysis in this article and subsequent articles in the series. I will then begin analyzing this data by describing the platform’s sell-through rate between October 2019 and October 2021. This is a basic measures of sales activity, often used in the collector car industry to compare auction houses and/or events. I will calculate the sell-through rate of a random sample of BaT auctions and how this rate has changed over time.
What is BaT? How does it work? #
Bring a Trailer is an online auction platform focused on the collector car market. The site was founded in 2007 as a blog for sharing interesting automotive classified ads. In 2014, BaT opened their online auction platform, capitalizing on the audience the site developed as a classified/auction link aggregator. The site’s rise in popularity and emergence as a mainstream collector car market force has been well documented by publications like the New York Times, Los Angeles Times, Bloomberg and auto industry publications like Hagerty. The site has seen substantial growth in auction sales each year, from $2 million in 2014, to $406 million in 2020. In 2020, the site was acquired by Hearst Communications, which owns the long-running automotive magazines Road & Track, Car and Driver and Autoweek.
Bring a Trailer has certain features that differentiate it from both traditional live auctions and online auctions like eBay. You can find a detailed explanation from BaT here, but I’ll outline a few relevant points. BaT’s most defining feature is perhaps the comment section included in each auction. Every auction has this chronologically sorted, flat feed of comments where any BaT member can leave comments. Bids on the auction also appear on the same feed, interspersed between comments according to chronological order. Potential bidders use the comment section to publicly ask questions about the lot. Commenters may praise the presentation, criticize, speculate about the final price or just idly chat about the lot. Experienced BaT sellers leverage the comment section as a competitive advantage over other auction platforms, actively participating in the discussion to shape the lot’s presentation and build confidence with prospective bidders. The ability to easily interact with the seller in public contrasts with traditional auction venues, where the consignee may be anonymous or only accessible to those with insider knowledge.
When an auction ends, BaT does not handle the monetary transaction. Instead, the buyer and seller are put in contact with each other to complete the sale directly, as a private party or dealer sale depending on the seller. BaT charges a small flat rate fee to sellers (as of this writing it is $99 per auction, increasing for premium auction options) and a 5% fee to buyers (minimum $250, capped at $5k). If a buyer refuses to go through with a sale after an auction ends, BaT’s main recourse is to keep this 5% fee, which is charged to the bidder at time of bidding. BaT also can and does ban buyers and sellers from the platform for not going through with auctions. The sale takes place “in private”, with BaT only stepping in if a dissatisfied party notifies them. The actual post-auction status of a sale, whether pending, completed or failed, is not reflected in the BaT listing page unless one of the involved parties decides to mention it in a comment.
Finally, like many high-end auction venues but unlike eBay or other online classifieds, BaT is curated. Sellers must apply to have their car listed and will be accepted or rejected at BaT’s discretion. The site does not publish acceptance rates, but it’s not difficult to find anecdotal accounts of would-be sellers being rejected from the site. BaT also determines whether the lot will be listed with a reserve and the reserve price. Sellers can negotiate this during the listing process but the final decision lies with BaT.
Let’s review the unique aspects of BaT before we move on, as these will have relevance for our later analysis.
- Auctions occur “in public”, with an open comments and bids section visible to all. This provides a communication channel to the seller as well as an area for public comment. It also provides a detailed chronological record of bids.
- BaT does not broker the sale once an auction closes. Instead, the transaction takes place directly between the high bidder and seller.
- BaT curates what lots appear on the site, and determines the lot’s reserve (subject to seller approval)
Methodology #
I gathered data from Bring A Trailer auctions closing between 10/1/2019 and 10/30/21. During this time period, BaT listed approximately 35,000 auctions, including the range of lot numbers from 23418 to 58494. Since it was impractical to gather data from all 35,000 auctions during the time period, I used a randomized sample. From lot numbers between 23418 and 58494, I randomly selected 600 lot numbers to use as the sample for analysis. These sample auctions are a cross-section of the types of items sold on this site. They include cars, trucks, and motorcycles dating from the 1930s through the present day. A tiny minority of the items are parts or memorabilia, rather than complete vehicles. All data used in this article is from this sample, unless otherwise indicated.
In order to collect data on auction results and bidding patterns, I developed a browser automation script written in Python. This script iterates through a list of lot numbers, uses Selenium webdriver and a headless Chrome instance to fetch associated auction urls and render bid activity, then parses data from the markup on the auction page. All data gathered by this method was public-facing, and did not require a BaT account to view. Randomized courtesy intervals of 2-5 seconds between each request or interaction were used in order to prevent excess load on BaT servers. I used a SQLite database for persistent storage of auction and bid data during the course of my analysis. This database contains two tables, auctions and bids, with schema as follows.
--each row of auctions stores information about an individual BaT auction
CREATE TABLE auctions
                (lot_number INTEGER PRIMARY KEY, --auction's lot number
                title TEXT, --BaT's auction title
                final_amount INTEGER, --hammer price of the auction
                end_time TEXT, --when the auction closed, to be deserialized into python datetime object
                sold INTEGER, --0 or 1 integer, representing boolean of whether lot was sold or not
                winner TEXT, --BaT username of winner, only if auction was sold
                url TEXT, --auction URL
                --the following columns contain unparsed html from the auction listing
                --they contain interesting information, so may be used in future analysis
                essentials_text TEXT, --contents of div with class "listing-essentials-content"
                result_text TEXT);  --contents of div with id "listing-bid-container"
--each row of bids contains information about an individual bid placed on an auction in the auction table
CREATE TABLE bids
                (lot_number INTEGER, --lot number of auction
                bidder TEXT, --BaT username of bidder
                amount INTEGER, --amount of bid
                time TEXT --time the bid was placed, to be deserialized into python datetime object
                );
After collecting this data, I wrote Python scripts for data transformation, analysis and visualization. I used pandas for data transformation and exploratory analysis. I also used statsmodels for some statistical tests. The visualizations in this article were created using the plotly and seaborn packages for Python.
We’re not going to use all the gathered data in this article, but we will use it in subsequent articles in this series.
Results #
Sell-through rate #
One of the most basic metrics of an auction’s overall performance is the sell-through rate. In a reserve auction, the sell-through rate is the percentage of lots where the hammer price meets or exceeds the reserve price during bidding and were therefore marked sold. This number is widely used as a metric of auction success. It can be understood as a proxy for both bidder interest in the lots presented and the auction house’s skill in setting reserve prices using their knowledge of the market. Auction houses will advertise high sell-through rates of past auctions in order to attract consignments, as it is one of the simplest, most attractive metrics to potential customers and an easy point of comparison. So what does Bring a Trailer’s sell-through rate look like?
Table 1.1: Count of sold lots and sell-through rate for all lots in sample, including no reserve lots.
| Result | Count | Percentage |
|---|---|---|
| Sold | 484 | 81% |
| Reserve not met | 116 | 19% |
| Total lots in sample | 600 |
According to Table 1.1., across the 600 lots in the sample, 484 met the reserve price and were therefore marked “Sold”, while the remaining 116 did not meet the reserve price. This indicates an 81% sell-through rate (rounded to the nearest percent). However, not all BaT lots are reserve auctions. By definition, lots without a reserve have a 100% sell-through rate, so they do not provide us any information about bidder interest or BaT’s skill in setting reserve prices. There are 159 no reserve lots in our sample, so let’s recalculate the sell-through rate without them.
Table 1.2: Count of sold lots and sell-through rate for reserve lots in sample
| Result | Count | Percentage |
|---|---|---|
| Sold | 325 | 74% |
| Reserve not met | 116 | 26% |
| Total reserve lots in sample | 441 |
The sell-through rate drops by 7%, to 74%. Sell-through rates are almost always advertised including no reserve auctions, so that 7% bump is significant when trying to gain a marketing advantage over rival auction houses. So how does BaT stack up to other auction houses? Let’s look at some recent results from traditional auction houses. For comparison, here are total sell-through rates from 5 recent major collector car auctions covered in the December 2021 issue of Sports Car Market.
Table 1.3: Total sell-through rates for recent auctions and BaT auction sample, including no reserve auctions. Data: Sports Car Market, Vol 33 No 12, December 2021.
| Auction | Lots Sold | Total Lots | Sell-through rate |
|---|---|---|---|
| Worldwide Auctioneers, Auburn, IN, USA. Sept. 3-4 2021 | 116 | 121 | 96% |
| RM Auctions, Auburn, IN, USA. Sept. 2-5, 2021 | 504 | 542 | 93% |
| GAA Classic, Greensboro, NC, July 22-24, 2021 | 553 | 615 | 90% |
| Bring a Trailer, Oct. 2019-Oct 2021 (random sample) | 484 | 600 | 81% |
| Bonhams MPH, Beaulieu, U.K., Sept. 5, 2021 | 85 | 119 | 71% |
| Artcurial, Monaco, July 19, 2021 | 65 | 121 | 54% |
Please note the BaT rate is derived from auctions spanning Oct. 2019 to 2021 while the other figures represent singular auction events. The data demonstrates that our BaT sample’s sell-through rate of 81% is within the range of rates achieved by traditional auction houses. In fact, the BaT sell through rate of 81% equals the mean sell-through rate of the 5 non-BaT auctions. Since the total sell-through rate can be manipulated by the auction house setting reserve prices or varying the number of lots listed at no reserve, this metric should primarily be considered as indicative of an auction house’s marketing and/or revenue-generating strategy. While it is commonly read as showing auction performance, without knowing the quantity of no reserve lots within each auction we are not making direct comparisons. We could even interpret the “unremarkableness” of BaT’s sell through rate instead as evidence of a trust-building marketing strategy to demonstrate the platform’s competitiveness and similarity to traditional auction houses.
There are a couple characteristics of the BaT platform that affect the reliability of sell-through data. BaT creates incentives for bidders and sellers to complete the transaction. If one party fails to follow through on their commitment to buy or sell, they are banned from the BaT and lose any fees paid to the platform. However, BaT cannot legally enforce whether a sale will take place once a vehicle is sold via auction. Once the auction completes, BaT provides both parties with each other’s contact information, and it is up to them to complete the transaction. These transactions do occasionally fall through, evidenced by relisted vehicles and occasional auction comments about failed sales. For reserve not met auctions, BaT will also send the high bidder’s contact information to the seller, who can then choose whether to negotiate a sale on their own terms. In either case, details about what happens after auction close are private by default and BaT does not publish any figures on the “true” sell-through rate.
If potential buyers and sellers judged an auction house’s performance solely by sell-through rates, BaT would be heavily incentivized to list auctions without a reserve and/or set reserves far below market value. However, under normal circumstances sellers and buyers do not choose to participate in an auction solely based on the fact that a sale is likely to occur. The seller is seeking to maximize their own revenue from a sale while the bidder seeks to win the auction with a hammer price equal to or less than their own estimate of the value. The non-fungible, indivisible nature of the assets sold at collector car auctions also creates a psychological emphasis on comparison of individual results, resulting in a culture of casual market analysis that de-emphasizes cumulative statistics like sell-through rates in favor of interpreting individual results. All participants in the auction (bidder, seller, auction house) tend to perceive hammer prices as more important than total sell-through rates and make decisions on whether to participate in a particular auction accordingly. In the next article in this series, we look at the distribution of hammer prices for the lots within our sample.
Change over time #
Anecdotally, vintage car enthusiasts and market watchers have noted rising prices for many sectors of the market during 2020 and 2021. According to Hagerty, a collector car insurance company and publisher, auction activity on Bring A Trailer has increased dramatically, both in the number of lots listed and total amount sold. During the first nine months of 2021 BaT sales totaled $483 million, more than all of 2020 and double the total in 2019. This article provides data for total sales between 2014 through September 2021, but they show it as a pie chart. Let’s visualize their data as a line chart, to better appreciate the site’s growth over time.
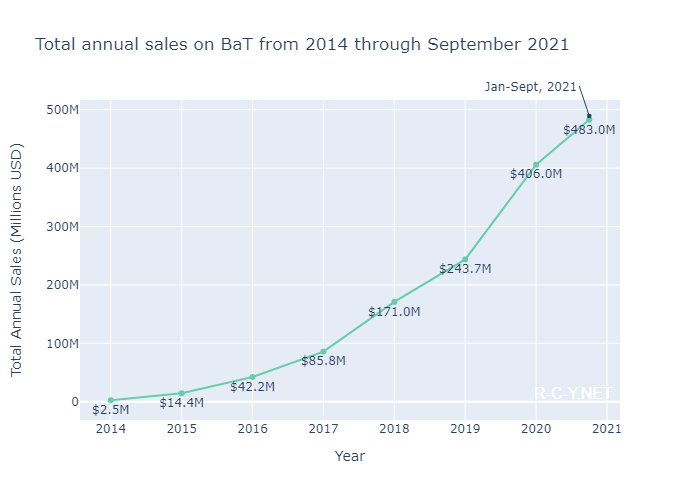
Figure 1.1: Total annual Bring A Trailer sales from 2014-October 2021.
Data: Hagerty
Along with increases in total sales, BaT has seen an increase in auction volume. Here is a plot of total number of lots listed on BaT per month during our sample period. This data was gathered by subtracting the last lot number of the month from the first lot number of the month. Because of small irregularities in the chronology of BaT’s numbering scheme (due to long-running premium listings and auction withdrawals), there may be an error on the order of ±5 lots per month.
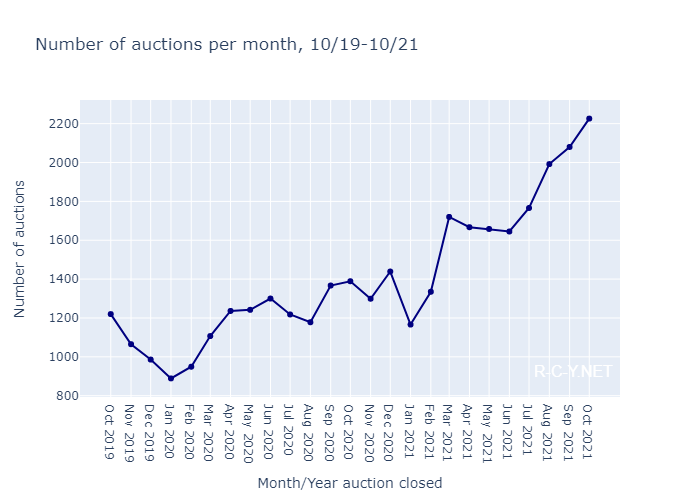
Figure 1.2: Count of BaT auctions per month/year from 10/2019 to 10/2021.
We’ve established that BaT has rapidly grown during our sample period. Has sell-through rate changed as well? Let’s plot the monthly real and total sell through rates during our sample period.
Note: This plot is interactive, so you can mouse over it for annotations and zoom/crop by clicking and dragging. If you have javascript disabled, you will see a non-interactive .png version.
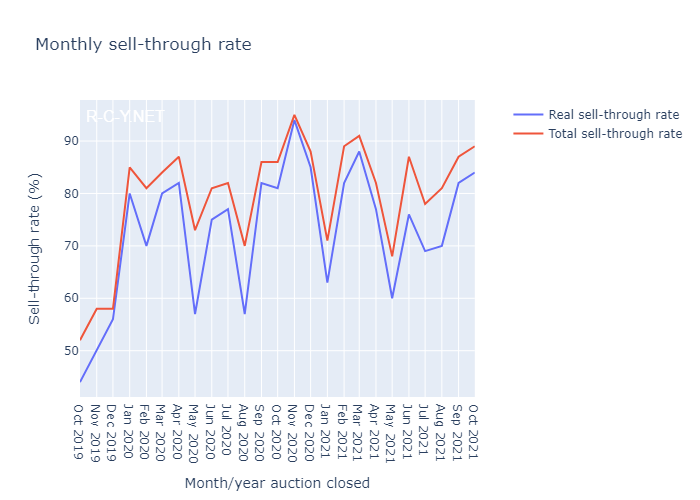
Figure 1.3: Monthly sell-through rates from 10/2019 to 10/2021
We see variation in the sell-through rate but no clear trend. During our sample period, real sell-through rate ranges from 44% to 94%, with a mean and median of 73%. When grouped by month/year, our sample also doesn’t give us a very large sample size for some months. The monthly count of reserve auctions in our sample ranges from 10 to 39.
While plotting monthly sell-through rates as percentages over time does not show a clear trend, there is another way we can statistically analyze whether there is a change in this rate. Binary logistic regression is a statistical technique that can be used to predict the value of a dichotomous variable (one with only two possible values, like sold/unsold) in response to a continuous variable (like time). Logistic regression provides an equation to predict this kind of relationship between variables, as well as test statistics that can describe the statistical significance of the regression model.
Note: If you want to learn more about the details of logistic regression, I suggest the StatQuest youtube series on the topic. However, it’s not necessary to understand this post, I’ll try to summarize the results in layman’s terms.
The plot below shows the number of sold and unsold lots plotted against the ending time of the auction. Each point represents a single auction from the pool of 441 reserve auctions in our sample. A value of 0 on the sold axis represents a reserve not met lot, while a value of 1 is a sold lot. All data points have either a 1 or 0 for the sold value, however they have been spaced out slightly along the y-axis to better show density of data points. The timestamp axis is the ending date/time of each auction, represented as a UNIX timestamp to provide a continuous variable for regression.
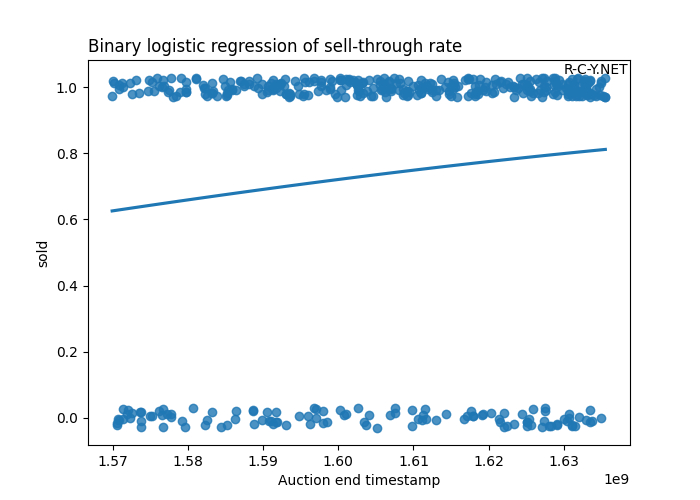
Figure 1.4: Binary logistic regression of lots sold and auction ending timestamp.
What does this tell us about the change in sell-through rate over time? The blue line is the prediction created by the binary logistic regression. It is a prediction of the change in probability of an auction reaching reserve over the duration of our sample. It slopes upwards as it moves rightward along the timestamp axis, indicating a gradual increase in sell-through rate over time.
In order to interpret this plot, let’s look at the results produced by running the binary logistic regression using the statsmodels python package. Don’t worry if these numbers mean nothing to you, I’ll summarize the result below.
                           Logit Regression Results
==============================================================================
Dep. Variable:                   sold   No. Observations:                  441
Model:                          Logit   Df Residuals:                      439
Method:                           MLE   Df Model:                            1
Date:                Tue, 25 Jan 2022   Pseudo R-squ.:                 0.01322
Time:                        09:07:01   Log-Likelihood:                -250.75
converged:                       True   LL-Null:                       -254.11
Covariance Type:            nonrobust   LLR p-value:                  0.009530
==============================================================================
                 coef    std err          z      P>|z|      [0.025      0.975]
------------------------------------------------------------------------------
Intercept    -22.1999      8.994     -2.468      0.014     -39.827      -4.573
timestamp   1.447e-08   5.61e-09      2.581      0.010    3.48e-09    2.55e-08
==============================================================================
How do we interpret this result? First, let’s look at the “coeff” value for timestamp. This is a positive number, indicating that our logistic regression model shows an increase in the probability of a sale as time goes on. This is consistent with the visual information provided by the plot in Figure 1.4. We can determine the size of this effect by looking at the “Pseudo R-squared” value, which is 0.013. This number can vary from 0 to 1. An R-squared value of 0 indicates a regression model that explains none of the variance in the result, while a value of 1 indicates that the model explains all the variance in the results. Our model’s R-squared value of 0.013 shows that the increase in the probability of a sale over time is small relative to the overall variation seen in the data. Finally, we can determine the statistical significance of our regression model by examining the “LLR p-value.” This value is 0.01, which is less than the standard significance value of 0.05. Since the value is below 0.05, we can say that this model is statistically significant and provides evidence for the existence of an effect in our data.
Conclusion #
In this article, I looked at the sell-through rate of a random sample of Bring A Trailer auctions. Sell-through rates are often used for marketing and comparison purposes by auction houses, however they usually report the total sell-through rate, which is affected by the presence of no reserve auctions. My findings were as follows:
- I analyzed 600 randomly selected Bring a Trailer auctions, closing between 10/1/2019 and 10/30/21. 441 of these (74%) were reserve auctions.
- BaT has rapidly grown during the sample period. During the first nine months of 2021 BaT sales totaled $483 million, more than all of 2020 and double the total in 2019. The number of auctions per month increased from approx. 1200 in October 2019 to approx. 2200 in October 2021.
- BaT auctions have a total 81% sell through rate during the sample period. After excluding no reserve auctions, the real sell-through rate was 74%.
- The 81% total sell-through rate is comparable to the rate achieved by conventional auto auction houses. For comparison, the mean total sell-through rate of the 5 traditional collector car auctions reported in the December 2021 issue of Sports Car Market was 81%.
- During our sample period, logistic regression analysis demonstrates that BaT’s sell-through rate increased a small but statistically significant amount.
To summarize, our data shows a very small but statistically significant increase in sell-through rate over time. While the effect size is small, we can expect auction platforms like BaT to adjust reserve prices in order to equilibrate sell-through rates. A relatively stable sell-through rate signals to prospective customers that the auction house has a good knowledge of the market and/or stable market conditions. Therefore, while the change in sell through rate over time is not very large, it still shows that the reserve-setting methods used by BaT have not maintained a stable sell-through rate during the last two years.
What are some plausible explanations for this effect? Increasing sell-through rate could be caused by a lag in BaT’s reserve prices responding to bull market conditions, a conscious decision by BaT to increase sell-through rates, a change in market knowledge due to expanding into new areas of the collector car market or staff turnover. It could also result from exogenous effects such as changing bidder behaviours. While our current data and analysis doesn’t give us tools to determine whether these explanations are valid, the actual mechanism is likely the result of many interacting effects. The rapid expansion of BaT and the exuberance of the overall collector car market during our sample period means both the auction platform and the market are changing rapidly.
In part two of this series, I will examine the distribution of hammer prices- in other words, how much are cars selling for and what are the relative quantities of different price levels? Stay tuned!